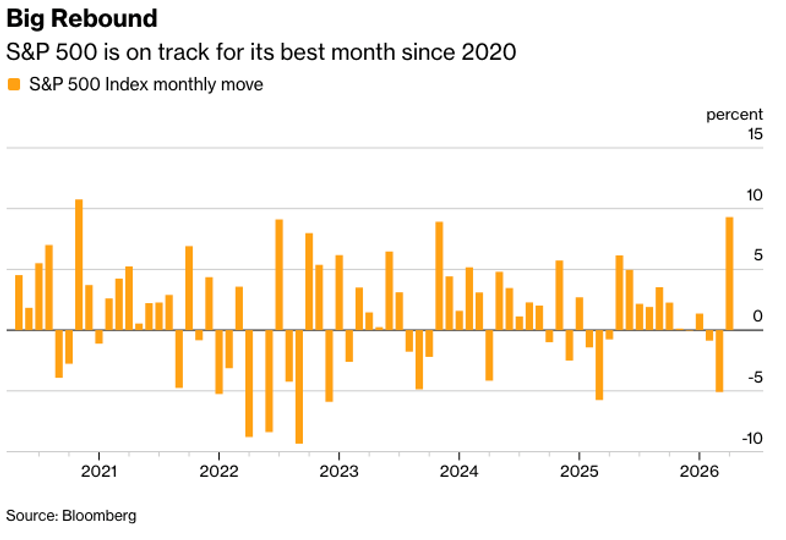
April marked a month of striking contrasts. The S&P 500 had just closed out its worst quarter since 2022, battered by the outbreak of war in the Middle East and a historic shock to global energy markets.[3] Fast forward just a few weeks, and the same index ended April at a brand new all-time high, recording its best monthly performance (approximately +10%) since the pandemic rebound of November 2020.[4] The tech-heavy Nasdaq soared around 15% on the back of renewed optimism and upbeat earnings.[5]
Source: https://www.bloomberg.com/news/articles/2026-04-30/us-equity-futures-rise-as-mega-cap-earnings-lift-tech-oil-drops
The Strait of Hormuz: Uncertainty Remains
After the war effectively closed the Strait of Hormuz, oil prices surged and sentiment grew increasingly pessimistic. A weekly survey by the American Association of Individual Investors showed bearish sentiment above 50%, a level reached only in about 5% of all weeks since the survey began in 1987.[6]
Source:: https://www.bloomberg.com/opinion/newsletters/2026-04-30/a-crude-awakening-on-inflation-is-hitting-markets
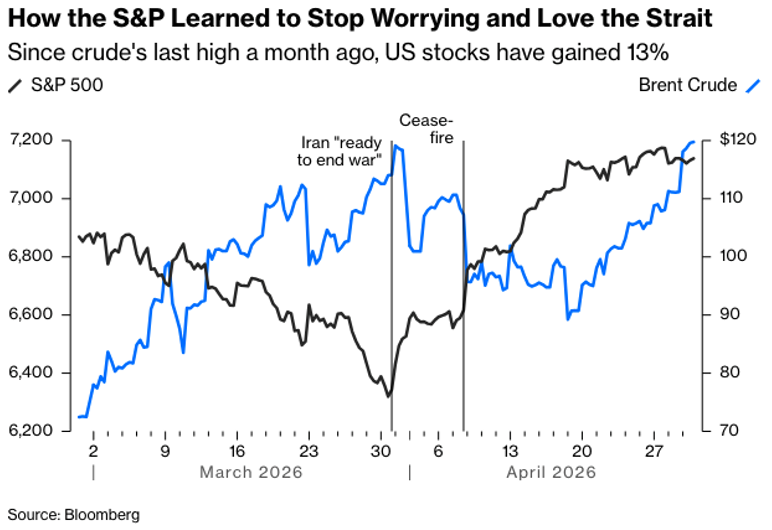
The first major turning point came on April 8, when Pakistan brokered a two-week ceasefire between the United States and Iran.[7] Markets responded immediately. The Nasdaq began what became 13 consecutive days of gains, its longest winning streak since 1992, as it breached all-time highs.[8] Iran’s Foreign Minister briefly announced the Strait was “completely open” for all commercial oil tankers, and oil prices dropped approximately 15% in a single session, with U.S. crude falling below $100 a barrel.[9]
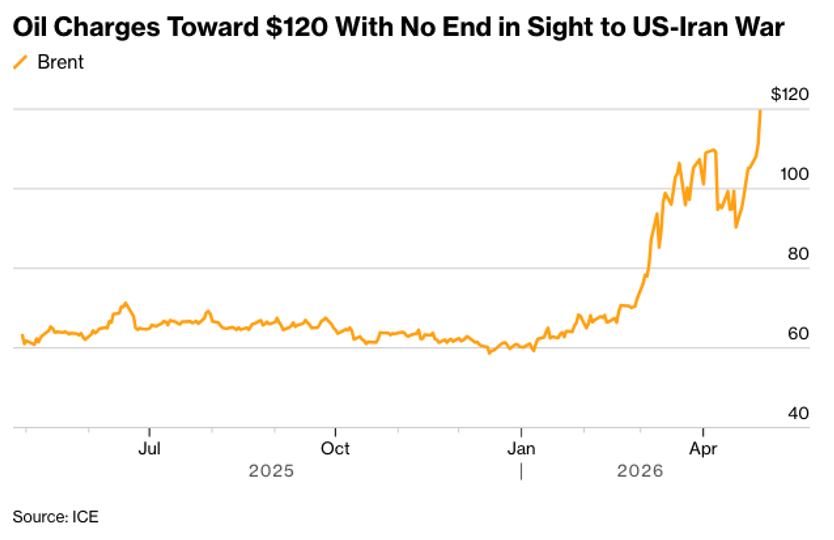
The optimism was short-lived. Iran reversed course, reinstating its hold over the waterway in response to a continuing U.S. naval blockade of Iranian ports.[10] A round of peace talks in Islamabad, led by Vice President Vance and U.S. special envoys, produced no agreement. The ceasefire expired on April 22.[11] Oil prices remained volatile, spiking to levels near $120 till far above the roughly $70 level that prevailed before the conflict.[12]
Interest Rate Uncertainty Fueled by Oil
Oil’s march towards $120 with no sustainable breakthrough in peace talks kept bonds under pressure. This also coincided with a murkier interest rate outlook.[13] Treasury yields followed March’s jump with a modest increase in April.[14]
The Federal Reserve (Fed) left interest rates on hold in, but the policy meeting raised the curtain on rising division within the committee as the extended conflict clouds the policy outlook.[15] Four Fed members dissented, with three disagreeing on language implying that the Fed’s next move would be a rate cut. As inflation remains above target, language suggesting an “easing bias” in interest rates appeared premature to them, given current price levels.[16] The Federal Open Market Committee (FOMC) vote hasn’t been this divided since 1992.[17] Markets read the meeting as more hawkish than expected, which brought more selling to Treasuries.[18]
Source: https://www.bloomberg.com/news/articles/2026-04-28/asian-stocks-set-for-muted-open-after-us-selloff-markets-wrap?fromMostRead=true
The dilemma extends well beyond the Fed. With oil having reached nearly double the cost from the start of the year, central banks globally are caught between the paths of cutting rates to support growth and hiking to fight inflation.[19] The favored option, for now, seems to be holding off on immediate policy moves.
Earnings Season: Defying Skeptics
Against this complex backdrop, corporate America delivered a remarkably strong earnings season. With 63% of S&P 500 companies having reported results as of May 1, 84% beat earnings-per-share estimates, well above the five-year average of 78% and the highest beat rate since Q2 2021.[20]
Most strikingly, the blended year-over-year earnings growth rate for Q1 has surged to 27.1%, up from the 13.1% estimate at the start of the quarter, marking the highest earnings growth rate since Q4 2021 and the sixth consecutive quarter of double-digit growth.[21] Net profit margins reached 14.7%, the highest level recorded since FactSet began tracking this metric in 2009.[22]
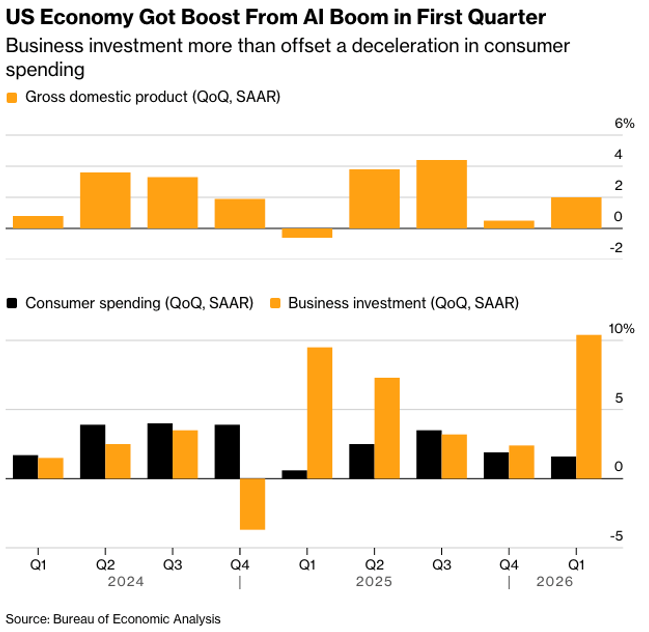
Source: https://www.bloomberg.com/news/articles/2026-04-30/us-economy-boosted-by-ai-boom-in-way-to-blunt-iran-war-impact
Much of the jump in earnings growth came from three of the “Magnificent Seven” mega-cap technology companies: Alphabet, Amazon, and Meta Platforms. Beyond the headline names, the broader picture was genuinely encouraging across multiple sectors.
Not only did companies report good numbers, but analysts actually raised Q2 2026 earnings estimates by 2.1% during April, the largest such increase in the first month of a quarter in five years. Seasonally, estimates typically fall by about 1 to 2% during this period.[23] For all of calendar year 2026, analysts now project earnings growth of 20.6%, with each of the remaining three quarters expected to deliver growth above 20%.[24]
Looking Ahead
April closed with both positivity and uncertainty in the air. The S&P 500’s record highs reflect underlying strength from expanding corporate profits, as first quarter earnings season wraps up in May. Markets seem to be leaning heavily on earnings resilience to look past geopolitical turmoil.
In the midst of each twist and turn in the headlines, we remain focused on designing sustainable portfolios for the long-term. Clarity comes from planning, not prediction. If you’d like to reconnect or check in about your strategy, we’d be happy to hear from you.
From your friends at JSF
The information expressed herein are those of JSF Financial, LLC, it does not necessarily reflect the views of NewEdge Securities, LLC. Neither JSF Financial LLC nor NewEdge Securities, LLC gives tax or legal advice. All opinions are subject to change without notice. Neither the information provided, nor any opinion expressed constitutes a solicitation or recommendation for the purchase, sale or holding of any security. Investing involves risk, including possible loss of principal. Indexes are unmanaged and cannot be invested in directly.
Historical data shown represents past performance and does not guarantee comparable future results. The information and statistical data contained herein were obtained from sources believed to be reliable but in no way are guaranteed by JSF Financial, LLC or NewEdge Securities, LLC as to accuracy or completeness. The information provided is not intended to be a complete analysis of every material fact respecting any strategy. The examples presented do not take into consideration commissions, tax implications, or other transactions costs, which may significantly affect the economic consequences of a given strategy. Diversification does not ensure a profit or guarantee against loss. Carefully consider the investment objectives, risks, charges and expenses of the trades referenced in this material before investing. Asset Allocation and Diversification do not guarantee a profit or protect against a loss.
The Bloomberg Barclays U.S. Aggregate Bond Index measures the investment-grade U.S. dollar-denominated, fixed-rate taxable bond market and includes Treasury securities, government-related and corporate securities, mortgage-backed securities, asset-backed securities and commercial mortgage-backed securities.
The S&P 500 Index is an unmanaged, market value-weighted index of 500 stocks generally representative of the broad stock market.
TLT-iShares 20 Plus Year Treasury Bond ETF seeks to track the investment results of an index composed of US Treasury bonds with remaining maturities greater than twenty years.
The CBOE Volatility Index (VIX) is a real-time index that represents the market’s expectations for the relative strength of near-term price changes of the S&P 500 Index (SPX). Because it is derived from the prices of SPX index options with near-term expiration dates, it generates a 30-day forward projection of volatility. Volatility, or how fast prices change, is often seen as a way to gauge market sentiment, and in particular the degree of fear among market participants.
The Nasdaq Composite is a market-capitalization-weighted index consisting of all Nasdaq Stock Exchange listed stocks that are not derivatives, preferred shares, funds, exchange-traded funds or debenture securities.
Treasury Bond- is a U.S. government debt security with a fixed interest rate and maturity between two and 10 years.
Gross domestic product (GDP) is a monetary measure of the market value of all the final goods and services produced in a specific time period. GDP is the most commonly used measure of economic activity.
By clicking on these links, you will leave our server, as they are located on another server. We have not independently verified the information available through this link. The link is provided to you as a matter of interest. Please click on the links below to leave and proceed to the selected site.
[1]https://advantage.factset.com/hubfs/Website/Resources Section/Research Desk/Earnings Insight/EarningsInsight_050126.pdf
[2]https://www.npr.org/2026/04/21/nx-s1-5793638/iran-middle-east-updates
[3]https://www.jsffinancial.com/oil-squeeze/
[4]https://finance.yahoo.com/markets/stocks/articles/p-500-logs-best-month-115358360.html
[5]https://www.wsj.com/finance/stocks/investors-ride-google-caterpillar-to-markets-best-month-since-2020-ca0fc08a?mod=Searchresults&pos=1&page=1
[6]https://www.fool.com/investing/2026/04/07/stock-market-flash-buy-signal-sp-500-do-this-next/
[7]https://www.npr.org/2026/04/21/nx-s1-5793638/iran-middle-east-updates
[8]https://www.cnbc.com/2026/04/16/stock-market-today-live-updates.html
[9]https://finance.yahoo.com/sectors/energy/articles/7-billion-perfectly-timed-oil-230000734.html
[10]https://www.pbs.org/newshour/world/irans-military-closes-strait-of-hormuz-again-citing-u-s-blockade
[11]https://www.npr.org/2026/04/21/nx-s1-5793638/iran-middle-east-updates
[12]https://www.postregister.com/businessreport/business/us-stocks-rally-to-the-finish-of-their-best-month-since-2020-even-as-oil/article_d19826e6-546f-5627-ab12-9f8a01421257.html
[13]https://www.bloomberg.com/news/articles/2026-04-28/asian-stocks-set-for-muted-open-after-us-selloff-markets-wrap?fromMostRead=true
[14]https://www.wsj.com/finance/investing/jgbs-fall-tracking-declines-in-u-s-treasurys-265b2fb4
[15]https://www.bloomberg.com/news/articles/2026-04-29/fed-holds-rates-three-officials-dissent-against-easing-bias?itm_source=record&itm_campaign=The_Fed&itm_content=Fed_Holds_Rates-1
[16]https://www.cnbc.com/2026/04/30/pce-inflation-rate-march-2026.html
[17]https://www.reuters.com/commentary/reuters-open-interest/spiking-central-bank-dissent-risks-stoking-volatility-2026-04-30/
[18]https://www.bloomberg.com/opinion/newsletters/2026-04-30/a-crude-awakening-on-inflation-is-hitting-markets
[19]https://www.reuters.com/commentary/reuters-open-interest/spiking-central-bank-dissent-risks-stoking-volatility-2026-04-30/
[20]https://advantage.factset.com/hubfs/Website/Resources Section/Research Desk/Earnings Insight/EarningsInsight_050126.pdf
[21]https://advantage.factset.com/hubfs/Website/Resources Section/Research Desk/Earnings Insight/EarningsInsight_050126.pdf
[22]https://advantage.factset.com/hubfs/Website/Resources Section/Research Desk/Earnings Insight/EarningsInsight_050126.pdf
[23]https://advantage.factset.com/hubfs/Website/Resources Section/Research Desk/Earnings Insight/EarningsInsight_050126.pdf
[24]https://advantage.factset.com/hubfs/Website/Resources Section/Research Desk/Earnings Insight/EarningsInsight_050126.pdf